Running OOD on a cluster with SLURM and 2 compute nodes (node1 and node2) I added “jupyter” under /etc/ood/config/apps and within that created an env file with contents with OOD_SSHHOST_ALLOWLIST=”node1.etc”
as recommended here SSH Error When Clicking "Host" in OOD Job Card
However, it dosen’t have any effect. The jobs starts - I can see it with ‘squeue’ - but when I “Connect to Jupyter” it’s a blank screen. I’m seeing something similar to what this user saw Blank Screen for Interactive Jupyter Session - #14 by uklineale
but that ticket had no real resolution that I could see. Perhaps these issues are unrelated, but it seems like it’s having trouble communicating with the server and I’m not sure how to debug. I checked /var/log for relevant errors. There are no errors reported by OOD. Opening the console reveals a lot of warnings and an error: Uncaught (in promise) ChunkLoadError: Loading chunk 1911 failed. I’ve been unsuccessful in tracking down what this means, other than it’s a javascript error.
Okay, the first issue I figured out. I was putting tho ood_sshhost_allowlist in jupyter/env rather than shell/env. That problem is checked off the list. Still a blank screen with jupyter.
Hi and welcome!
I guess I would ask if the issues you see in the network tab/console/etc are around timing out (like the requests take longer than 60 seconds) or if they’re the wrong URLs (they fail fast with a 404 or similar status code).
It looks like 503 errors. Firefox just shows warnings of the flavor:
Loading failed for the <script> with source
But chrome says:
Failed to load resource: the server responded with a status of 503 (Service Unavailable)
I can’t find any errors that OOD is reporting.
It’s probably worth noting that the setup is a bit wonky, because we’re still testing how/if this will work, so we’re using localhost to get into ondemand. We were able to get job composer and the shell logins to work, but jupyter is proving elusive.
OK so if you’re getting 503s, then we next have to figure out if it’s apache that’s returning the 503s or Jupyter itself. Is there anything in the output.log that would suggest if Jupyter is returning the 503s?
No, I can’t find anything in the output log, at least not the one in the session space. I poked around in /var/log as well and couldn’t find any specific error.
Could it be lacking in memory? Maybe I need to figure out how to get the job more memory.
OK so in the network tab of your browser, we need to find if the 503s are coming from apache or jupyter.
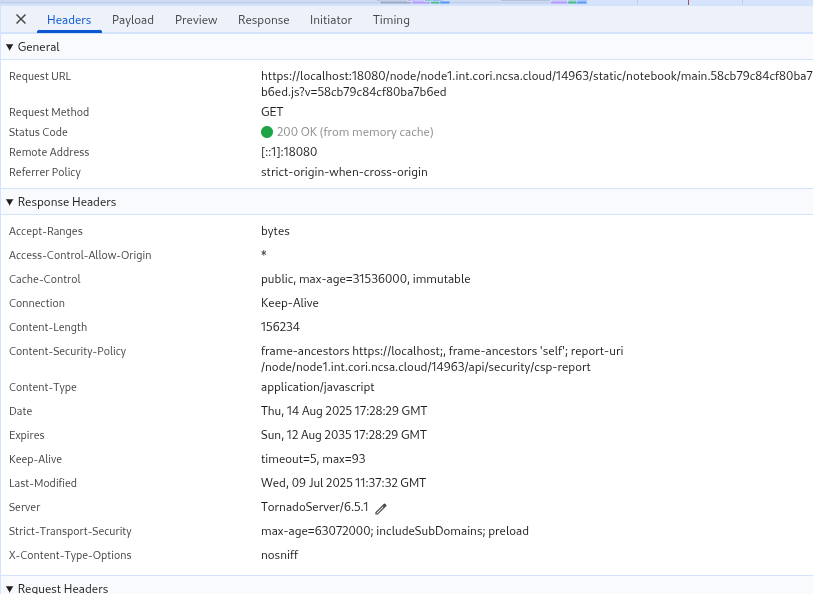
Navigate to the network tab and choose any of the 503s you’ve encountered.
This was 200/OK for me, but as you can see in the response headers - it’s from TornadoServer which is Jupyter.
Also you may be able to increase the logging level in the Jupyter application. I see at least a few requests being logged in the session I just started.
I’m not entirely sure how to interpret this. I’m thinking it’s apache that’s struggling?
firefox
chromium
From the output log:
[I 2025-08-14 17:28:29.022 ServerApp] User 176da132f6ff42328db86711b6b7a02b logged in.
[I 2025-08-14 17:28:29.023 ServerApp] 302 POST /node/node1.int.cori.ncsa.cloud/14963/login (176da132f6ff42328db86711b6b7a02b@192.168.2.201) 1.67ms
[I 2025-08-14 17:28:29.045 ServerApp] 302 GET /node/node1.int.cori.ncsa.cloud/14963/ (@192.168.2.201) 0.43ms
[W 2025-08-14 17:28:55.993 ServerApp] 404 GET /node/node1.int.cori.ncsa.cloud/14963/static/notebook/main.58cb79c84cf80ba7b6ed.js.map?v=58cb79c84cf80ba7b6ed (176da132f6ff42328db86711b6b7a02b@192.168.2.201) 22.76ms referer=None
[W 2025-08-14 17:28:56.013 ServerApp] 404 GET /node/node1.int.cori.ncsa.cloud/14963/static/notebook/notebook_core.5321b49dd3857d00ab82.js.map?v=5321b49dd3857d00ab82 (176da132f6ff42328db86711b6b7a02b@192.168.2.201) 1.38ms referer=None
[W 2025-08-14 17:29:37.906 ServerApp] 404 GET /node/node1.int.cori.ncsa.cloud/14963/static/notebook/main.58cb79c84cf80ba7b6ed.js.map?v=58cb79c84cf80ba7b6ed (176da132f6ff42328db86711b6b7a02b@192.168.2.201) 1.97ms referer=None
[W 2025-08-14 17:29:37.922 ServerApp] 404 GET /node/node1.int.cori.ncsa.cloud/14963/static/notebook/notebook_core.5321b49dd3857d00ab82.js.map?v=5321b49dd3857d00ab82 (176da132f6ff42328db86711b6b7a02b@192.168.2.201) 1.01ms referer=None
This one is the only “error” (in firefox)
It’s network record looks like:
OK that 503 does appear to be from apache, not Jupyter. It could be that apache itself is resource constrained.
That said - there should be something in /var/log/httpd that could tell us something. Does grepping for c375ee return anything? (that’s part of the js asset you’re trying to request in the image above).
Stands to reason that apache should be logging something in some log to indicate why it’s failing.
Yeah, I do see some things:
./localhost_error_ssl.log:[Thu Aug 14 17:36:44.862174 2025] [lua:info] [pid 187865:tid 139988402394880] [client ::1:50560] req_user_ip=“::1” req_is_websocket=“false” local_user=“jallen17” req_origin=“” req_handler=“proxy:http://node1.int.cori.ncsa.cloud/14963/static/notebook:1871” remote_user=“jallen17” res_content_disp=“” req_filename=“proxy:http://node1.int.cori.ncsa.cloud/14963/static/notebook:1871/node/node1.int.cori.ncsa.cloud/14963/static/notebook/1871.c375ee093b7e51966390.js?v=c375ee093b7e51966390” res_content_length=“73” log_id=“aJ4erBuBWabX-ZJBVae2WAAAAE8” req_is_https=“true” time_proxy=“1.825” res_content_type=“text/html; charset=iso-8859-1” req_protocol=“HTTP/1.1” req_accept_language=“en-us,en;q=0.9” time_user_map=“0.003” req_port=“18080” req_accept_charset=“” log_hook=“ood” res_content_language=“” log_time=“2025-08-14T17:36:44.862092.0Z” res_location=“” req_status=“503” req_referer=“https://localhost:18080/node/node1.int.cori.ncsa.cloud/14963/tree” res_content_location=“” req_content_type=“” req_accept_encoding=“gzip, deflate, br, zstd” res_content_encoding=“” req_uri=“/node/node1.int.cori.ncsa.cloud/14963/static/notebook/1871.c375ee093b7e51966390.js” allowed_hosts=“localhost” req_hostname=“localhost” req_method=“GET” req_cache_control=“” req_accept=“/” req_server_name=“localhost” req_user_agent=“Mozilla/5.0 (X11; Linux x86_64) AppleWebKit/537.36 (KHTML, like Gecko) Chrome/138.0.0.0 Safari/537.36”, referer: https://localhost:18080/node/node1.int.cori.ncsa.cloud/14963/tree?
I can’t see any actual error.
Okay, I tried a tail -f on tat localhost_error_ssl file and reloaded jupyter, then I saw a couple of failed lines:
[Thu Aug 14 17:53:19.186257 2025] [proxy:error] [pid 187864:tid 139988150777600] (111)Connection refused: AH00957: HTTP: attempt to connect to 192.168.1.114:80 (*) failed
It looks like it’s trying to connect to port 80, but apache is not on port 80 due to a conflict. Could that be it?
I’m not sure if that’s what we’re looking for. Jupyter will boot on a port higher than 1024. For example in your screen shots it’s on port 14963, not 80.
Is 192.168.1.114 even the compute node? We need to find logs that are attempts to connect to jupyter on the compute node - whatever that ip and port combination may be (it’s part of the URL there, /node/<host>/<port>).
Yeah, that’s the compute node, according to /etc/hosts. That’s the node1.int.cori.etc node. Okay, so I need to check the logs on the compute node it sounds like to see what’s happening there?
So the logs on the compute log getting git are secure, messages, and lastlog. lastlog seems to be a binary file. When I start jupyter notebook, node1’s secure gives this:
Aug 14 18:23:12 node1 su[285551]: pam_systemd(su-l:session): Failed to create session: Invalid leader PID
Aug 14 18:23:12 node1 su[285551]: pam_unix(su-l:session): session opened for user jallen17 by (uid=0)
Aug 14 18:23:15 node1 su[285551]: pam_unix(su-l:session): session closed for user jallen17
The messages file shows:
Aug 14 18:24:14 node1 slurmd[1636]: slurmd: task/affinity: task_p_slurmd_batch_request: task_p_slurmd_batch_request: 154
Aug 14 18:24:14 node1 slurmd[1636]: slurmd: task/affinity: batch_bind: job 154 CPU input mask for node: 0x7
Aug 14 18:24:14 node1 slurmd[1636]: slurmd: task/affinity: batch_bind: job 154 CPU final HW mask for node: 0x7
Aug 14 18:24:14 node1 slurmd[1636]: slurmd: debug:  Waiting for job 154's prolog to complete
Aug 14 18:24:14 node1 slurmd[1636]: slurmd: debug:  prep/script: _run_spank_job_script: _run_spank_job_script: calling /opt/software/slurm/sbin/slurmstepd spank prolog
Aug 14 18:24:14 node1 slurmd[285852]: spank-prolog: debug:  Running spank/prolog for jobid [154] uid [60009] gid [60009]
Aug 14 18:24:14 node1 slurmd[285852]: spank-prolog: debug:  spank: opening plugin stack /etc/slurm/plugstack.conf
Aug 14 18:24:14 node1 slurmd[285852]: spank-prolog: debug:  spank: /etc/slurm/plugstack.conf:1: Loaded plugin cc-tmpfs_mounts.so
Aug 14 18:24:14 node1 slurmd[285852]: spank-prolog: debug:  cc-tmpfs_mounts: Unable to get job's restart count
Aug 14 18:24:14 node1 slurmd[1636]: slurmd: debug:  Finished wait for job 154's prolog to complete
Aug 14 18:24:14 node1 slurmd[1636]: slurmd: _get_user_env: get env for user jallen17 here
Aug 14 18:24:14 node1 su[285859]: (to jallen17) root on none
Aug 14 18:24:14 node1 cvmfs2[285922]: (restricted.computecanada.ca) (manager 'standard') switching proxy from (none) to http://192.168.0.95:3128 (192.168.0.95). Reason: set random start proxy from the first proxy group [Current host: http://cvmfs-s1-arbutus.computecanada.ca:8000/cvmfs/restricted.computecanada.ca]
Aug 14 18:24:14 node1 cvmfs2[285922]: (restricted.computecanada.ca) (manager 'standard') geographic order of servers retrieved from cvmfs-s1-arbutus.computecanada.ca
Aug 14 18:24:14 node1 cvmfs2[285922]: (restricted.computecanada.ca) (manager 'external') switching proxy from (none) to http://192.168.0.95:3128 (192.168.0.95). Reason: cloned [Current host: http://cvmfs-s1-beluga.computecanada.ca:8000/cvmfs/restricted.computecanada.ca]
Aug 14 18:24:14 node1 cvmfs2[285922]: (restricted.computecanada.ca) (manager 'external') switching proxy from http://192.168.0.95:3128 (192.168.0.95) to DIRECT. Reason: set random start proxy from the first proxy group [Current host: ]
Aug 14 18:24:14 node1 cvmfs2[285922]: (restricted.computecanada.ca) (manager 'standard') switching proxy from http://192.168.0.95:3128 (192.168.0.95) to DIRECT. Reason: failed proxy [Current host: http://cvmfs-s1-beluga.computecanada.ca:8000/cvmfs/restricted.computecanada.ca]
Aug 14 18:24:14 node1 cvmfs2[285922]: (restricted.computecanada.ca)  - id 1) switching host from http://cvmfs-s1-beluga.computecanada.ca:8000/cvmfs/restricted.computecanada.ca to http://cvmfs-s1-graham.computecanada.ca:8000/cvmfs/restricted.computecanada.ca (host returned HTTP error)
Aug 14 18:24:14 node1 cvmfs2[285922]: (restricted.computecanada.ca)  - id 1) switching host from http://cvmfs-s1-graham.computecanada.ca:8000/cvmfs/restricted.computecanada.ca to http://cvmfs-s1-arbutus.computecanada.ca:8000/cvmfs/restricted.computecanada.ca (host returned HTTP error)
Aug 14 18:24:14 node1 cvmfs2[285922]: (restricted.computecanada.ca) failed to download repository manifest (9 - host returned HTTP error)
Aug 14 18:24:14 node1 cvmfs2[285922]: (restricted.computecanada.ca) Failed to initialize root file catalog (16 - file catalog failure)
Aug 14 18:24:15 node1 lmod-1.0[285981]: H=node1.int.cori.ncsa.cloud U=jallen17 SJ=- MJ=- TJ=- J=- M=CCconfig FN=/cvmfs/soft.computecanada.ca/custom/modules/CCconfig.lua UL=no hierarchy=na arch=generic root=/cvmfs/soft.computecanada.ca MN=CCconfig MV=- cuda=na mpi=na compiler=na cluster=computecanada MUN=CCconfig prop=na
Aug 14 18:24:15 node1 lmod-1.0[285984]: H=node1.int.cori.ncsa.cloud U=jallen17 SJ=- MJ=- TJ=- J=- M=gentoo/2023 FN=/cvmfs/soft.computecanada.ca/custom/modules/gentoo/2023.lua UL=no hierarchy=na arch=generic root=/cvmfs/soft.computecanada.ca MN=gentoo MV=2023 cuda=na mpi=na compiler=na cluster=computecanada MUN=gentoo/2023 prop=na
Aug 14 18:24:15 node1 lmod-1.0[285985]: H=node1.int.cori.ncsa.cloud U=jallen17 SJ=- MJ=- TJ=- J=- M=gcccore/.12.3 FN=/cvmfs/soft.computecanada.ca/easybuild/modules/2023/x86-64-v3/Core/gcccore/.12.3.lua UL=no hierarchy=Core arch=generic root=/cvmfs/soft.computecanada.ca MN=gcccore MV=.12.3 cuda=na mpi=na compiler=na cluster=computecanada MUN=gcccore/.12.3 prop=na
Aug 14 18:24:15 node1 lmod-1.0[285986]: H=node1.int.cori.ncsa.cloud U=jallen17 SJ=- MJ=- TJ=- J=- M=gcc/12.3 FN=/cvmfs/soft.computecanada.ca/easybuild/modules/2023/x86-64-v3/Core/gcc/12.3.lua UL=no hierarchy=Core arch=generic root=/cvmfs/soft.computecanada.ca MN=gcc MV=12.3 cuda=na mpi=na compiler=na cluster=computecanada MUN=gcc prop=tools
Aug 14 18:24:15 node1 lmod-1.0[285987]: H=node1.int.cori.ncsa.cloud U=jallen17 SJ=- MJ=- TJ=- J=- M=hwloc/2.9.1 FN=/cvmfs/soft.computecanada.ca/easybuild/modules/2023/x86-64-v3/Compiler/gcccore/hwloc/2.9.1.lua UL=no hierarchy=Compiler arch=generic root=/cvmfs/soft.computecanada.ca MN=hwloc MV=2.9.1 cuda=na mpi=na compiler=gcccore cluster=computecanada MUN=hwloc/2.9.1 prop=na
Aug 14 18:24:15 node1 lmod-1.0[285988]: H=node1.int.cori.ncsa.cloud U=jallen17 SJ=- MJ=- TJ=- J=- M=ucx/1.14.1 FN=/cvmfs/soft.computecanada.ca/easybuild/modules/2023/x86-64-v3/Compiler/gcccore/ucx/1.14.1.lua UL=no hierarchy=Compiler arch=generic root=/cvmfs/soft.computecanada.ca MN=ucx MV=1.14.1 cuda=na mpi=na compiler=gcccore cluster=computecanada MUN=ucx/1.14.1 prop=na
Aug 14 18:24:15 node1 lmod-1.0[285989]: H=node1.int.cori.ncsa.cloud U=jallen17 SJ=- MJ=- TJ=- J=- M=libfabric/1.18.0 FN=/cvmfs/soft.computecanada.ca/easybuild/modules/2023/x86-64-v3/Compiler/gcccore/libfabric/1.18.0.lua UL=no hierarchy=Compiler arch=generic root=/cvmfs/soft.computecanada.ca MN=libfabric MV=1.18.0 cuda=na mpi=na compiler=gcccore cluster=computecanada MUN=libfabric/1.18.0 prop=na
Aug 14 18:24:15 node1 lmod-1.0[285990]: H=node1.int.cori.ncsa.cloud U=jallen17 SJ=- MJ=- TJ=- J=- M=pmix/4.2.4 FN=/cvmfs/soft.computecanada.ca/easybuild/modules/2023/x86-64-v3/Compiler/gcccore/pmix/4.2.4.lua UL=no hierarchy=Compiler arch=generic root=/cvmfs/soft.computecanada.ca MN=pmix MV=4.2.4 cuda=na mpi=na compiler=gcccore cluster=computecanada MUN=pmix/4.2.4 prop=na
Aug 14 18:24:15 node1 lmod-1.0[285991]: H=node1.int.cori.ncsa.cloud U=jallen17 SJ=- MJ=- TJ=- J=- M=ucc/1.2.0 FN=/cvmfs/soft.computecanada.ca/easybuild/modules/2023/x86-64-v3/Compiler/gcccore/ucc/1.2.0.lua UL=no hierarchy=Compiler arch=generic root=/cvmfs/soft.computecanada.ca MN=ucc MV=1.2.0 cuda=na mpi=na compiler=gcccore cluster=computecanada MUN=ucc/1.2.0 prop=na
Aug 14 18:24:15 node1 lmod-1.0[285992]: H=node1.int.cori.ncsa.cloud U=jallen17 SJ=- MJ=- TJ=- J=- M=openmpi/4.1.5 FN=/cvmfs/soft.computecanada.ca/easybuild/modules/2023/x86-64-v3/Compiler/gcc12/openmpi/4.1.5.lua UL=no hierarchy=Compiler arch=generic root=/cvmfs/soft.computecanada.ca MN=openmpi MV=4.1.5 cuda=na mpi=na compiler=gcc12 cluster=computecanada MUN=openmpi prop=mpi
Aug 14 18:24:15 node1 lmod-1.0[285993]: H=node1.int.cori.ncsa.cloud U=jallen17 SJ=- MJ=- TJ=- J=- M=flexiblas/3.3.1 FN=/cvmfs/soft.computecanada.ca/easybuild/modules/2023/x86-64-v3/Compiler/gcc12/flexiblas/3.3.1.lua UL=no hierarchy=Compiler arch=generic root=/cvmfs/soft.computecanada.ca MN=flexiblas MV=3.3.1 cuda=na mpi=na compiler=gcc12 cluster=computecanada MUN=flexiblas prop=na
Aug 14 18:24:15 node1 lmod-1.0[285994]: H=node1.int.cori.ncsa.cloud U=jallen17 SJ=- MJ=- TJ=- J=- M=imkl/2023.2.0 FN=/cvmfs/soft.computecanada.ca/easybuild/modules/2023/x86-64-v3/Core/imkl/2023.2.0.lua UL=no hierarchy=Core arch=generic root=/cvmfs/soft.computecanada.ca MN=imkl MV=2023.2.0 cuda=na mpi=na compiler=na cluster=computecanada MUN=imkl prop=math
Aug 14 18:24:15 node1 lmod-1.0[285995]: H=node1.int.cori.ncsa.cloud U=jallen17 SJ=- MJ=- TJ=- J=- M=StdEnv/2023 FN=/cvmfs/soft.computecanada.ca/custom/modules/StdEnv/2023.lua UL=yes hierarchy=na arch=generic root=/cvmfs/soft.computecanada.ca MN=StdEnv MV=2023 cuda=na mpi=na compiler=na cluster=computecanada MUN=StdEnv/2023 prop=na
Aug 14 18:24:17 node1 slurmd[1636]: slurmd: Launching batch job 154 for UID 60009
I don’t actually see an httpd directory on the nodes in /var/log
Nothing really seems to happen in the node1 logs when I click “connect to jupyter” maybe those logs are elsewhere?
No we need the apache httpd logs in /var/log/httpd that reference proxying to compute node. Specifically proxying to the Jupyter instance on the compute node. Not sure who or what is trying to proxy to the compute node on port 80, but you need to find apache log lines on the web node (the node running OnDemand) that reference the compute node on a very high port for example 14963.
So with that you’d be searching for 192.168.1.114:14963 just for example. The port is going to change every time you boot Jupyter, so it’s not that specifically, but it will be much higher than 1024.
And/or you can search for the assets being requested that have failed. Again, using your image as an example, you got a 503 for the URL /node/node1.int.cori.ncsa.cloud/14963/static/notebook/main.58cb79c84cf80ba7b6ed.js. There may be something in the web nodes’s apache logs (the node with OnDemand installed on it) for this URL specifically. You know you got a 503 for this URL, so apache may have logged something about this URL. You can search the logs for a substring like 58cb79c or 58cb79c84cf80ba7b6ed (I may have written that wrong when copying from the image, so there may be a typo here, but you should be able to copy and paste from your browser).
I was trying to investigate this and I ran httpd -V and the first line is:
httpd: Syntax error on line 356 of /etc/httpd/conf/httpd.conf: Could not open configuration file /etc/httpd/conf.d/ood-portal.conf: Permission denied
I will redo the configuration according to the docs. Even if that doesn’t fix this it’s probably not going to hurt.
I redid my certificates, updated the ood_portal.yml file. Re-ran update_ood_portal, restarted apache. Now when I re-run httpd -V everything looks good. Logged into OOD and viola: jupyter starts up.
Really appreciate the help in tracking this down @jeff.ohrstrom!