Hey Jeff!
I went ahead and toyed with the httpd performance settings under the mpm.conf file (specifically /etc/httpd/conf.modules.d/00-mpm.conf). I tried quite a few settings, and ultimately landed around here:
<IfModule mpm_event_module>

  # ServerLimit is MaxRequestWorkers / ThreadsPerChild
  ServerLimit            64
  StartServers           8
  MaxRequestWorkers      250
  MinSpareThreads        75
  MaxSpareThreads        250
  ThreadsPerChild        25
  MaxRequestsPerChild    0
  ThreadLimit            256
  ListenBacklog          255
</IfModule>
OOD is running on one of our login nodes, which has the follow specs:
[root@login01 conf.modules.d]# lscpu | grep -i "cpu(s)"
CPU(s):                               64

[root@login01 conf.modules.d]# free -g
               total        used        free      shared  buff/cache   available
Mem:             125           8         117           5           5         116
Swap:              0           0           0
Unfortunately modifying this file did not resolve the intermittent latency issues (let me know if I was way off with the parameters).
I have been doing some more digging, however, and am beginning to wonder if the latency issues are due to authentication.
I changed the LogLevel for httpd to debug, and begain tailing the file /var/log/httpd/error.log.
Within the OOD portal, when I would select another tab, the logs would hang at this point:
[Tue Aug 05 17:30:53.679694 2025] [ssl:debug] [pid 63093:tid 63233] ssl_engine_kernel.c(415): [client 172.31.32.132:63440] AH02034: Initial (No.1) HTTPS request received for child 1809 (server scu-ood.wave.scu.edu:443), referer: https://scu-ood.wave.scu.edu/pun/sys/dashboard/
[Tue Aug 05 17:30:53.679838 2025] [authz_core:debug] [pid 63093:tid 63233] mod_authz_core.c(815): [client 172.31.32.132:63440] AH01626: authorization result of Require valid-user : denied (no authenticated user yet), referer: https://scu-ood.wave.scu.edu/pun/sys/dashboard/
[Tue Aug 05 17:30:53.679852 2025] [authz_core:debug] [pid 63093:tid 63233] mod_authz_core.c(815): [client 172.31.32.132:63440] AH01626: authorization result of <RequireAny>: denied (no authenticated user yet), referer: https://scu-ood.wave.scu.edu/pun/sys/dashboard/
[Tue Aug 05 17:30:54.713600 2025] [authnz_pam:info] [pid 63093:tid 63233] [client 172.31.32.132:63440] PAM authentication passed for user apelkey, referer: https://scu-ood.wave.scu.edu/pun/sys/dashboard/
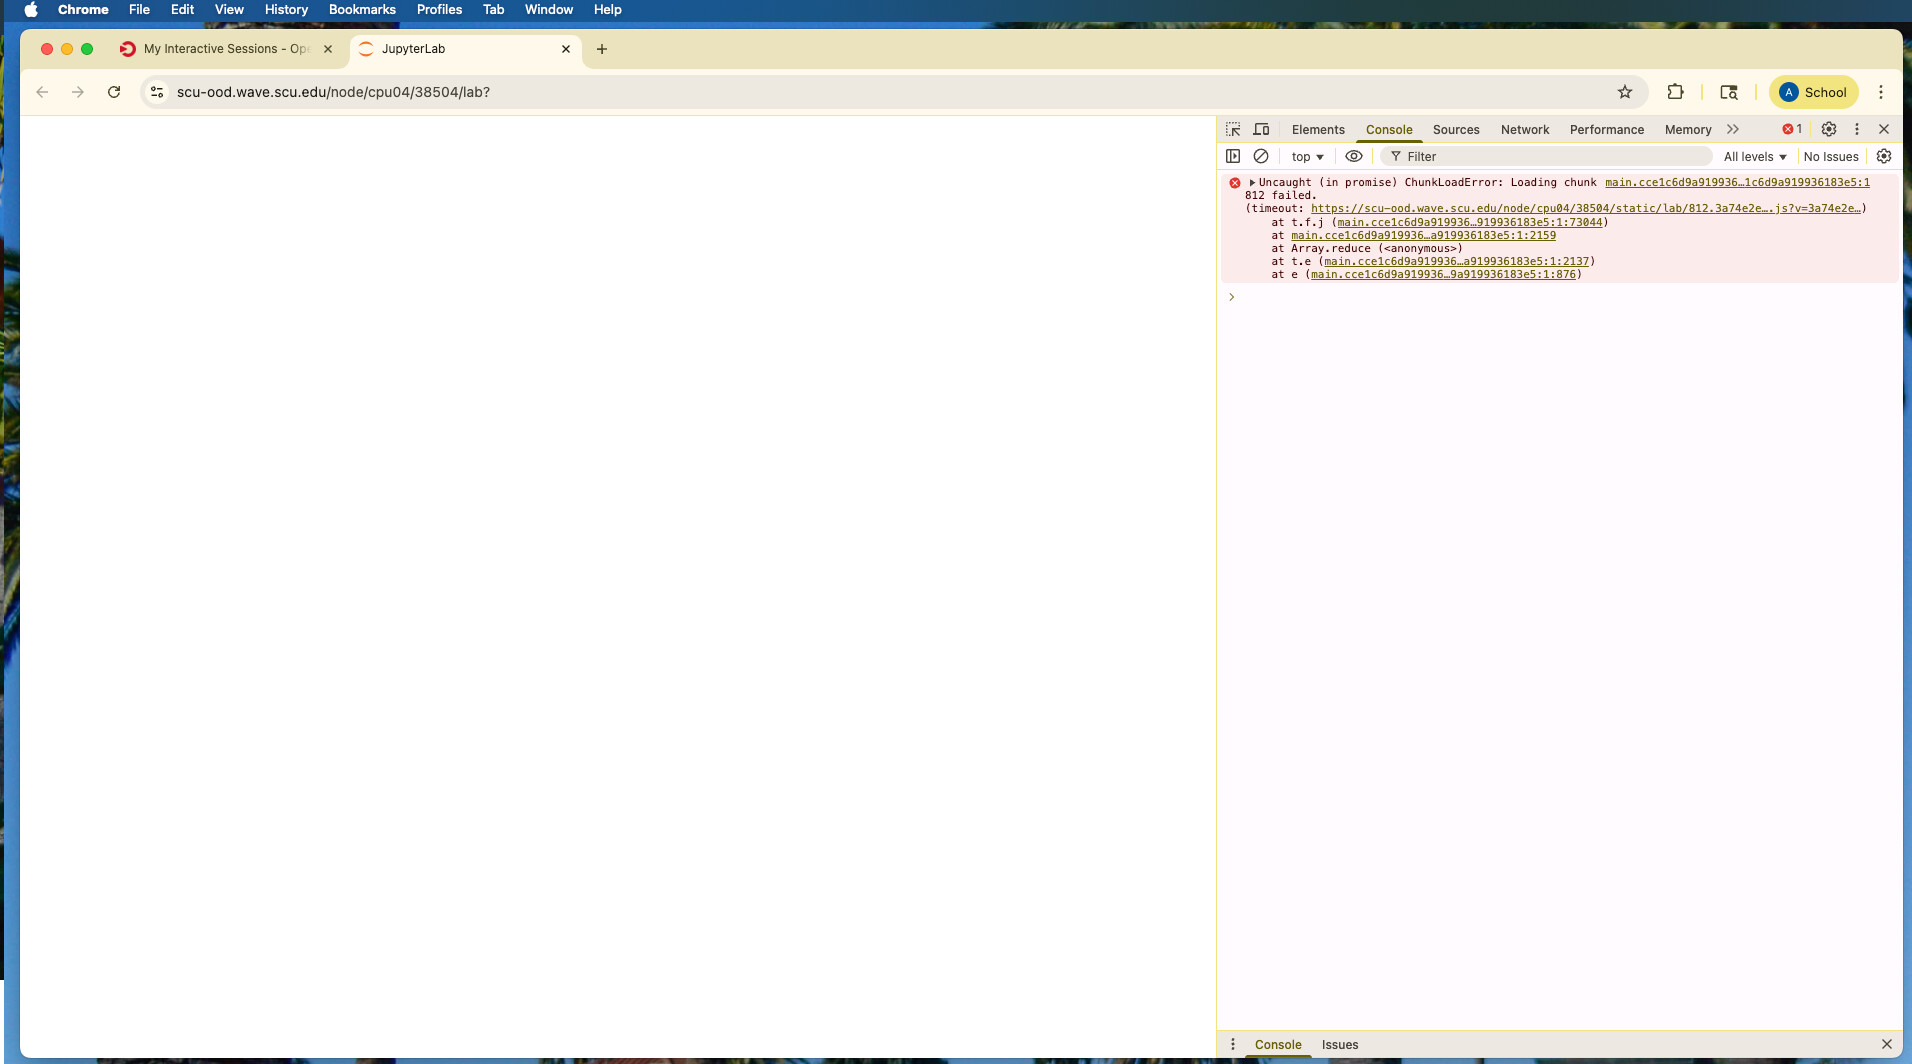
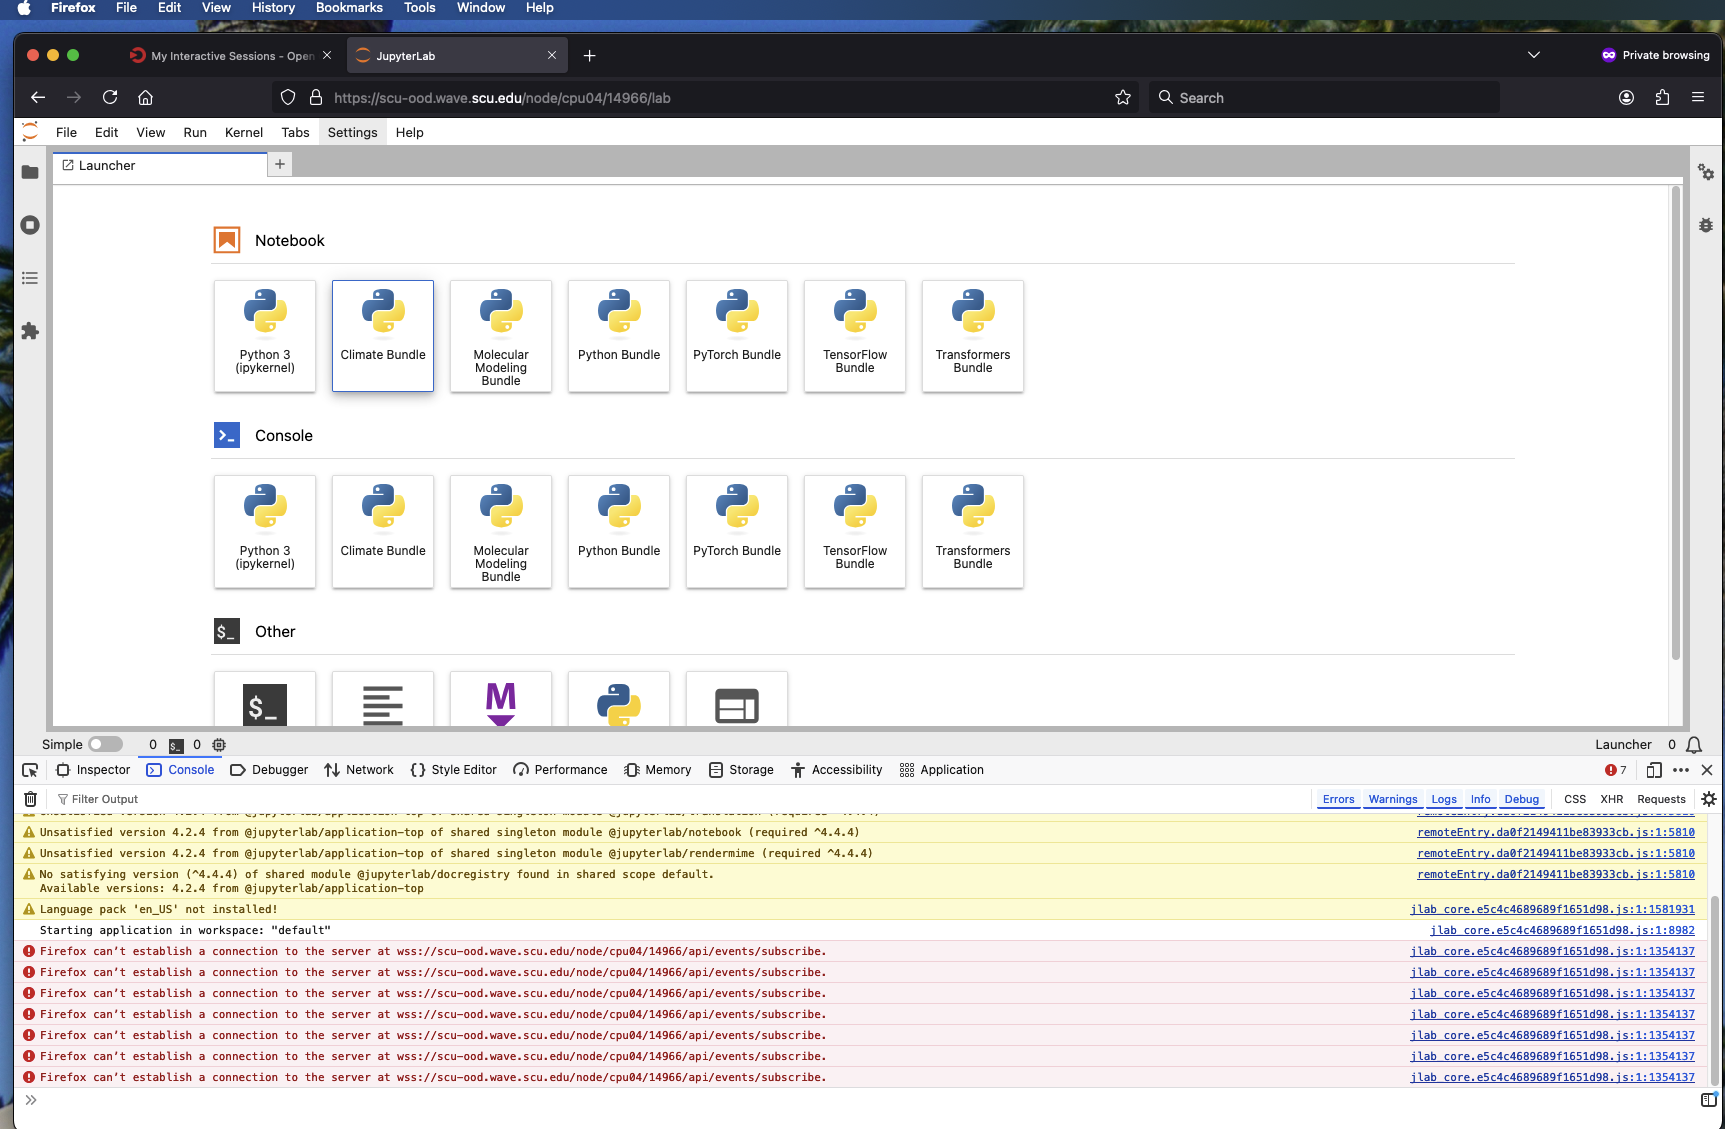
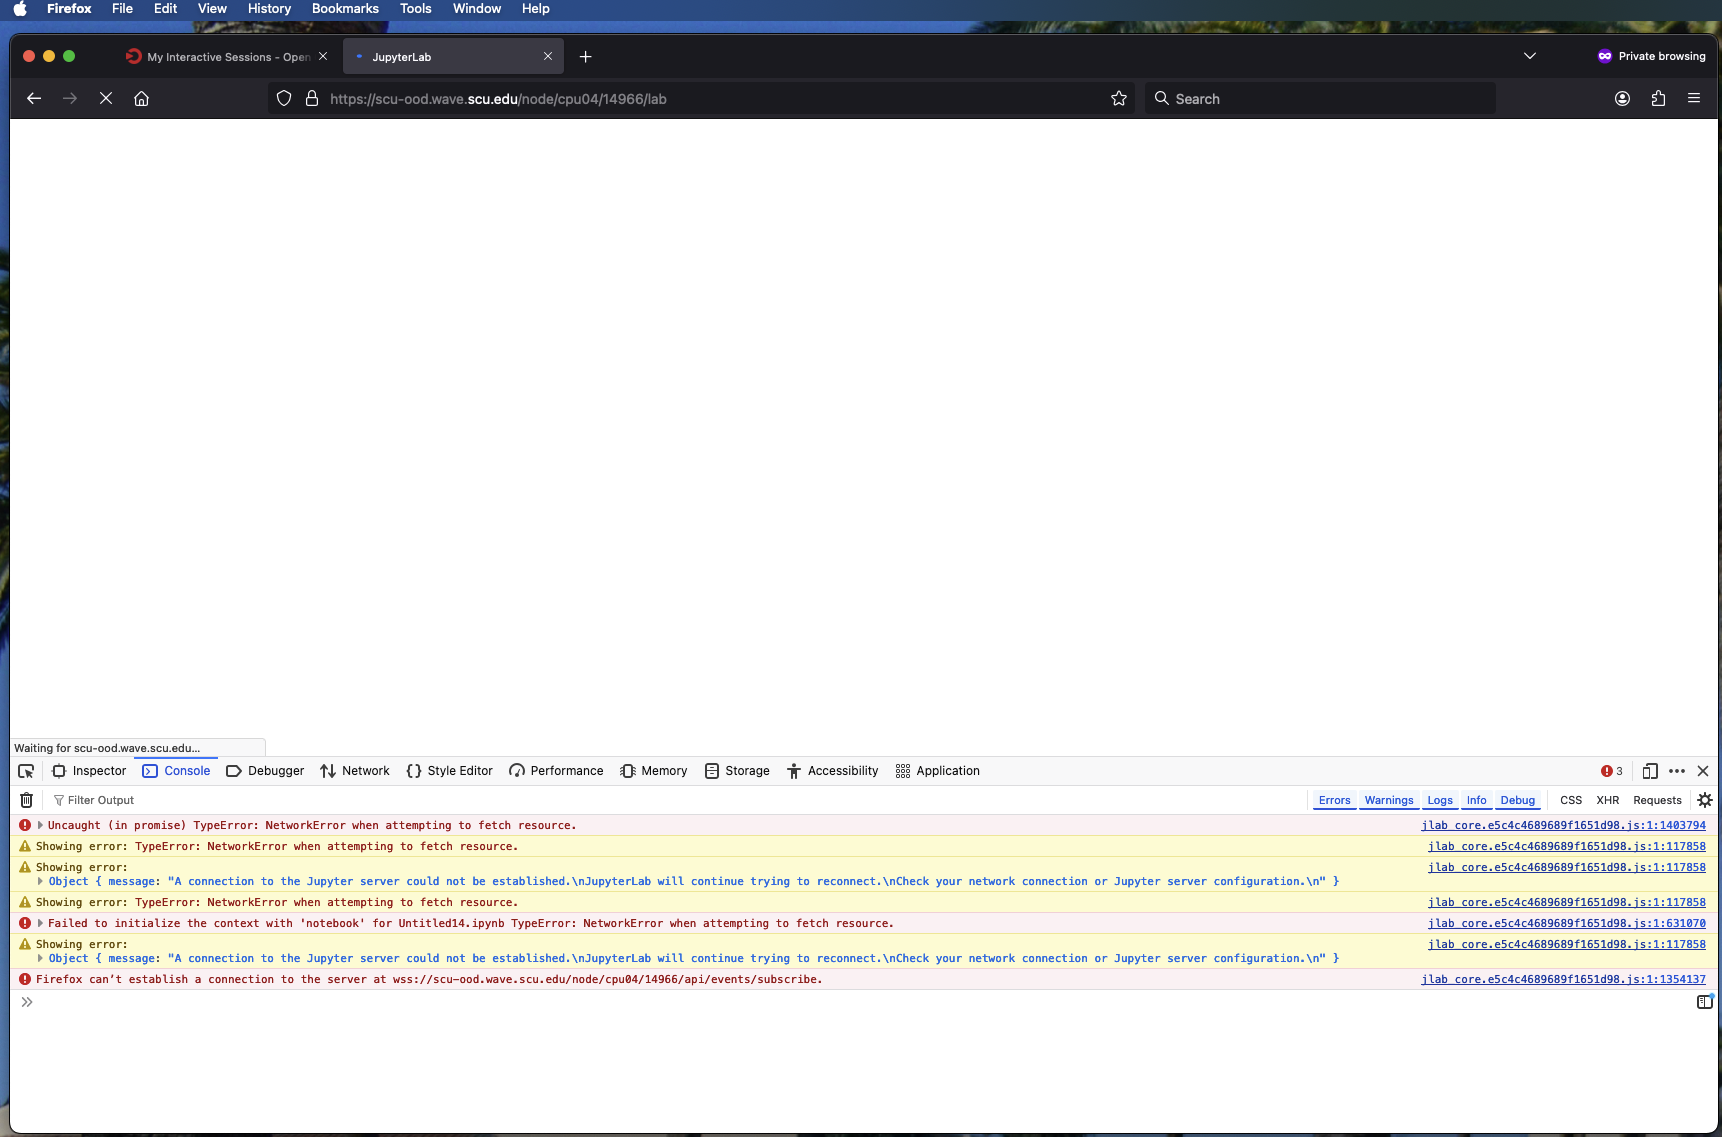
Furthermore, regarding the JupyterHub application, when the app would hang or fail to launch, the following logs would be repeated:
[Tue Aug 05 17:08:27.547285 2025] [lua:info] [pid 62909:tid 63096] [client 172.31.32.132:62554] req_accept_language="en-us,en;q=0.9" req_method="POST" remote_user="apelkey" req_origin="https://scu-ood.wave.scu.edu" req_content_type="application/x-www-form-urlencoded" res_content_length="0" req_server_name="scu-ood.wave.scu.edu" res_location="/node/cpu04/38655/" req_hostname="scu-ood.wave.scu.edu" log_time="2025-08-05T17:08:27.547226.0Z" req_user_agent="Mozilla/5.0 (Macintosh; Intel Mac OS X 10_15_7) AppleWebKit/537.36 (KHTML, like Gecko) Chrome/138.0.0.0 Safari/537.36" res_content_type="text/html; charset=utf-8" req_protocol="HTTP/1.1" res_content_encoding="" req_filename="proxy:http://cpu04:38655/node/cpu04/38655/login" req_status="302" res_content_language="" local_user="apelkey" allowed_hosts="scu-ood.wave.scu.edu" req_uri="/node/cpu04/38655/login" req_handler="proxy:http://cpu04:38655" res_content_disp="" res_content_location="" log_id="aJI6i6iWHmbGgJ1bxi6ixgAABAw" req_cache_control="max-age=0" time_user_map="0.002" req_accept="text/html,application/xhtml+xml,application/xml;q=0.9,image/avif,image/webp,image/apng,*/*;q=0.8,application/signed-exchange;v=b3;q=0.7" req_is_https="true" req_referer="https://scu-ood.wave.scu.edu/pun/sys/dashboard/batch_connect/sessions" log_hook="ood" req_port="443" req_user_ip="172.31.32.132" time_proxy="3.753" req_accept_charset="" req_is_websocket="false" req_accept_encoding="gzip, deflate, br, zstd", referer: https://scu-ood.wave.scu.edu/pun/sys/dashboard/batch_connect/sessions
[Tue Aug 05 17:08:27.552674 2025] [ssl:debug] [pid 62909:tid 63097] ssl_engine_kernel.c(415): [client 172.31.32.132:62554] AH02034: Subsequent (No.2) HTTPS request received for child 1037 (server scu-ood.wave.scu.edu:443), referer: https://scu-ood.wave.scu.edu/pun/sys/dashboard/batch_connect/sessions
[Tue Aug 05 17:08:27.552734 2025] [authz_core:debug] [pid 62909:tid 63097] mod_authz_core.c(815): [client 172.31.32.132:62554] AH01626: authorization result of Require valid-user : denied (no authenticated user yet), referer: https://scu-ood.wave.scu.edu/pun/sys/dashboard/batch_connect/sessions
[Tue Aug 05 17:08:27.552739 2025] [authz_core:debug] [pid 62909:tid 63097] mod_authz_core.c(815): [client 172.31.32.132:62554] AH01626: authorization result of <RequireAny>: denied (no authenticated user yet), referer: https://scu-ood.wave.scu.edu/pun/sys/dashboard/batch_connect/sessions
[Tue Aug 05 17:08:27.580092 2025] [authnz_pam:info] [pid 62909:tid 63097] [client 172.31.32.132:62554] PAM authentication passed for user apelkey, referer: https://scu-ood.wave.scu.edu/pun/sys/dashboard/batch_connect/sessions
[Tue Aug 05 17:08:27.582120 2025] [authz_core:debug] [pid 62909:tid 63097] mod_authz_core.c(815): [client 172.31.32.132:62554] AH01626: authorization result of Require valid-user : granted, referer: https://scu-ood.wave.scu.edu/pun/sys/dashboard/batch_connect/sessions
[Tue Aug 05 17:08:27.582126 2025] [authz_core:debug] [pid 62909:tid 63097] mod_authz_core.c(815): [client 172.31.32.132:62554] AH01626: authorization result of <RequireAny>: granted, referer: https://scu-ood.wave.scu.edu/pun/sys/dashboard/batch_connect/sessions
[Tue Aug 05 17:08:27.582426 2025] [proxy:debug] [pid 62909:tid 63097] mod_proxy.c(1467): [client 172.31.32.132:62554] AH01143: Running scheme http handler (attempt 0), referer: https://scu-ood.wave.scu.edu/pun/sys/dashboard/batch_connect/sessions
[Tue Aug 05 17:08:27.582435 2025] [proxy_ajp:debug] [pid 62909:tid 63097] mod_proxy_ajp.c(785): [client 172.31.32.132:62554] AH00894: declining URL http://cpu04:38655/node/cpu04/38655/, referer: https://scu-ood.wave.scu.edu/pun/sys/dashboard/batch_connect/sessions
[Tue Aug 05 17:08:27.582440 2025] [proxy_fcgi:debug] [pid 62909:tid 63097] mod_proxy_fcgi.c(1091): [client 172.31.32.132:62554] AH01076: url: http://cpu04:38655/node/cpu04/38655/ proxyname: (null) proxyport: 0, referer: https://scu-ood.wave.scu.edu/pun/sys/dashboard/batch_connect/sessions
[Tue Aug 05 17:08:27.582444 2025] [proxy_fcgi:debug] [pid 62909:tid 63097] mod_proxy_fcgi.c(1096): [client 172.31.32.132:62554] AH01077: declining URL http://cpu04:38655/node/cpu04/38655/, referer: https://scu-ood.wave.scu.edu/pun/sys/dashboard/batch_connect/sessions
[Tue Aug 05 17:08:27.582447 2025] [proxy:debug] [pid 62909:tid 63097] proxy_util.c(2797): AH00942: http: has acquired connection for (*:80)
[Tue Aug 05 17:08:27.582451 2025] [proxy:debug] [pid 62909:tid 63097] proxy_util.c(3242): [client 172.31.32.132:62554] AH00944: connecting http://cpu04:38655/node/cpu04/38655/ to cpu04:38655, referer: https://scu-ood.wave.scu.edu/pun/sys/dashboard/batch_connect/sessions
[Tue Aug 05 17:08:27.582495 2025] [proxy:debug] [pid 62909:tid 63097] proxy_util.c(3450): [client 172.31.32.132:62554] AH00947: connecting /node/cpu04/38655/ to 10.160.7.104:38655 (cpu04:38655), referer: https://scu-ood.wave.scu.edu/pun/sys/dashboard/batch_connect/sessions
[Tue Aug 05 17:08:27.582711 2025] [proxy:debug] [pid 62909:tid 63097] proxy_util.c(3956): AH02824: http: connection established with 10.160.7.104:38655 (cpu04:38655)
[Tue Aug 05 17:08:27.582718 2025] [proxy:debug] [pid 62909:tid 63097] proxy_util.c(4144): AH00962: http: connection complete to 10.160.7.104:38655 (cpu04)
[Tue Aug 05 17:08:27.584165 2025] [proxy:debug] [pid 62909:tid 63097] proxy_util.c(2813): AH00943: *: has released connection for (*:80)
[Tue Aug 05 17:08:27.584171 2025] [proxy:debug] [pid 62909:tid 63097] proxy_util.c(4068): [remote 10.160.7.104:38655] AH02642: proxy: connection shutdown
[Tue Aug 05 17:08:27.584426 2025] [lua:info] [pid 62909:tid 63097] [client 172.31.32.132:62554] req_user_ip="172.31.32.132" req_referer="https://scu-ood.wave.scu.edu/pun/sys/dashboard/batch_connect/sessions" res_content_type="text/html; charset=utf-8" res_content_disp="" remote_user="apelkey" log_id="aJI6i6iWHmbGgJ1bxi6ixwAABA0" req_cache_control="max-age=0" req_port="443" req_content_type="" res_content_length="0" req_protocol="HTTP/1.1" req_handler="proxy:http://cpu04:38655" res_content_encoding="" req_origin="" res_content_location="" allowed_hosts="scu-ood.wave.scu.edu" req_is_websocket="false" log_time="2025-08-05T17:08:27.584370.0Z" log_hook="ood" req_status="302" req_accept_charset="" time_user_map="0.001" req_filename="proxy:http://cpu04:38655/node/cpu04/38655/" req_user_agent="Mozilla/5.0 (Macintosh; Intel Mac OS X 10_15_7) AppleWebKit/537.36 (KHTML, like Gecko) Chrome/138.0.0.0 Safari/537.36" local_user="apelkey" time_proxy="1.995" res_location="/node/cpu04/38655/lab?" res_content_language="" req_accept_language="en-us,en;q=0.9" req_uri="/node/cpu04/38655/" req_is_https="true" req_server_name="scu-ood.wave.scu.edu" req_hostname="scu-ood.wave.scu.edu" req_method="GET" req_accept_encoding="gzip, deflate, br, zstd" req_accept="text/html,application/xhtml+xml,application/xml;q=0.9,image/avif,image/webp,image/apng,*/*;q=0.8,application/signed-exchange;v=b3;q=0.7", referer: https://scu-ood.wave.scu.edu/pun/sys/dashboard/batch_connect/sessions
[Tue Aug 05 17:08:27.589688 2025] [ssl:debug] [pid 62909:tid 63100] ssl_engine_kernel.c(415): [client 172.31.32.132:62554] AH02034: Subsequent (No.3) HTTPS request received for child 1038 (server scu-ood.wave.scu.edu:443), referer: https://scu-ood.wave.scu.edu/pun/sys/dashboard/batch_connect/sessions
[Tue Aug 05 17:08:27.589783 2025] [authz_core:debug] [pid 62909:tid 63100] mod_authz_core.c(815): [client 172.31.32.132:62554] AH01626: authorization result of Require valid-user : denied (no authenticated user yet), referer: https://scu-ood.wave.scu.edu/pun/sys/dashboard/batch_connect/sessions
[Tue Aug 05 17:08:27.589789 2025] [authz_core:debug] [pid 62909:tid 63100] mod_authz_core.c(815): [client 172.31.32.132:62554] AH01626: authorization result of <RequireAny>: denied (no authenticated user yet), referer: https://scu-ood.wave.scu.edu/pun/sys/dashboard/batch_connect/sessions
[Tue Aug 05 17:08:27.614805 2025] [authnz_pam:info] [pid 62909:tid 63100] [client 172.31.32.132:62554] PAM authentication passed for user apelkey, referer: https://scu-ood.wave.scu.edu/pun/sys/dashboard/batch_connect/sessions
[Tue Aug 05 17:08:27.616891 2025] [authz_core:debug] [pid 62909:tid 63100] mod_authz_core.c(815): [client 172.31.32.132:62554] AH01626: authorization result of Require valid-user : granted, referer: https://scu-ood.wave.scu.edu/pun/sys/dashboard/batch_connect/sessions
[Tue Aug 05 17:08:27.616897 2025] [authz_core:debug] [pid 62909:tid 63100] mod_authz_core.c(815): [client 172.31.32.132:62554] AH01626: authorization result of <RequireAny>: granted, referer: https://scu-ood.wave.scu.edu/pun/sys/dashboard/batch_connect/sessions
[Tue Aug 05 17:08:27.617204 2025] [proxy:debug] [pid 62909:tid 63100] mod_proxy.c(1467): [client 172.31.32.132:62554] AH01143: Running scheme http handler (attempt 0), referer: https://scu-ood.wave.scu.edu/pun/sys/dashboard/batch_connect/sessions
[Tue Aug 05 17:08:27.617211 2025] [proxy_ajp:debug] [pid 62909:tid 63100] mod_proxy_ajp.c(785): [client 172.31.32.132:62554] AH00894: declining URL http://cpu04:38655/node/cpu04/38655/lab?, referer: https://scu-ood.wave.scu.edu/pun/sys/dashboard/batch_connect/sessions
[Tue Aug 05 17:08:27.617215 2025] [proxy_fcgi:debug] [pid 62909:tid 63100] mod_proxy_fcgi.c(1091): [client 172.31.32.132:62554] AH01076: url: http://cpu04:38655/node/cpu04/38655/lab? proxyname: (null) proxyport: 0, referer: https://scu-ood.wave.scu.edu/pun/sys/dashboard/batch_connect/sessions
[Tue Aug 05 17:08:27.617218 2025] [proxy_fcgi:debug] [pid 62909:tid 63100] mod_proxy_fcgi.c(1096): [client 172.31.32.132:62554] AH01077: declining URL http://cpu04:38655/node/cpu04/38655/lab?, referer: https://scu-ood.wave.scu.edu/pun/sys/dashboard/batch_connect/sessions
[Tue Aug 05 17:08:27.617222 2025] [proxy:debug] [pid 62909:tid 63100] proxy_util.c(2797): AH00942: http: has acquired connection for (*:80)
[Tue Aug 05 17:08:27.617226 2025] [proxy:debug] [pid 62909:tid 63100] proxy_util.c(3242): [client 172.31.32.132:62554] AH00944: connecting http://cpu04:38655/node/cpu04/38655/lab? to cpu04:38655, referer: https://scu-ood.wave.scu.edu/pun/sys/dashboard/batch_connect/sessions
[Tue Aug 05 17:08:27.617269 2025] [proxy:debug] [pid 62909:tid 63100] proxy_util.c(3450): [client 172.31.32.132:62554] AH00947: connecting /node/cpu04/38655/lab? to 10.160.7.104:38655 (cpu04:38655), referer: https://scu-ood.wave.scu.edu/pun/sys/dashboard/batch_connect/sessions
Apologies for the block of code, I have attached the output file below for further inspection.
I took a look at the OOD architecture referenced here and I am wondering if the issue might be between the apache server and the authentication, whether it be from apache itself or the auth provider. When OOD does run “fast” I see no hang time in the logs around the authentication portion, and in regard to Jupyter I see PAM authentication marked as successful and then the application launches.
Could this be a plausible cause for the behavior we are seeing? If so, would have any advice as to how I can debug this further?
Lastly, authentication for this setup was handled via PAM on a Rocky9 host provisioned via WareWulf. I am currently talking with the universities infrastructure team to see if we can tie in OIDC with Dex to the existing infrastructure, but there is no ETA on that. Here is the configuration that was used for auth, as well as the docs which were referenced. Add PAM Authentication — Open OnDemand 1.8.12 documentation
auth:
  - 'AuthType Basic'
  - 'AuthName "Open OnDemand"'
  - 'AuthBasicProvider PAM'
  - 'AuthPAMService ood'
  - 'Require valid-user'

# Lua regular expression used to map authenticated-user to system-user
# This configuration is ignored if user_map_cmd is defined
# Example:
#     user_map_match: '^([^@]+)@.*$'
# Default: '.*'
user_map_match: '.*'
httpd_error.log.txt (325.9 KB)